Physical Analyses
Examples of Analysis of Rare Earth Magnet
(Neodymium Magnet)
High Resolution EBSD & FE-EPMA Analysis
Rare Earth Magnet (Neodymium Magnet)
Sintered rare earth magnets are used in a wide range of applications, from electronics to automotive motors. Because magnetic flux density is increased by aligning the crystal orientation of the main phase (Nd2Fe14B), it is important to know the orientation and grain size at the individual crystal grain level.
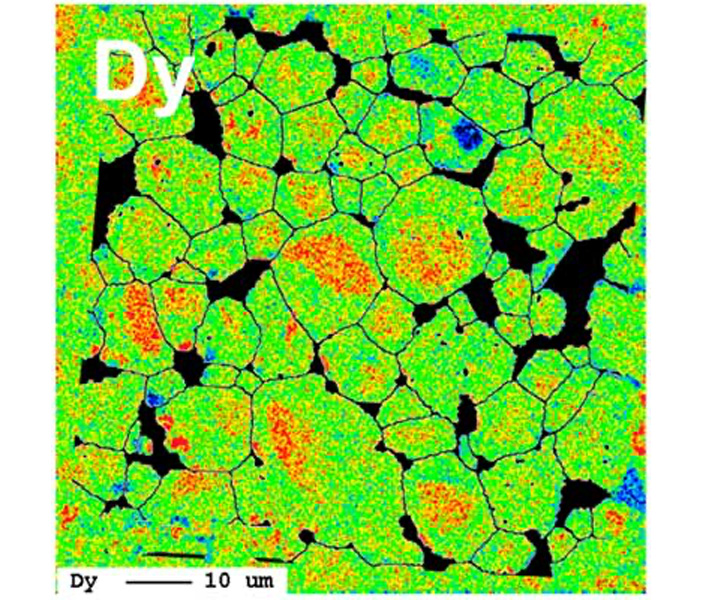
Dysprosium (Dy) is a rare earth element which is added to magnets to prevent deterioration of magnetic force at high temperature. However, in recent years, unstable supply of Dy has become a problem. To reduce dependence on this key element, efficient distribution of Dy in magnets at the lowest possible concentration is necessary.
It is possible the visualize the distribution of Dy at grain boundaries by analyzing the distribution of the orientations of individual microscopic grains by high resolution EBSD, and overlapping the obtained grain boundaries (grain map) on mapping by FE-EPMA.
Distribution of Crystal Orientation in Commercial Neodymium Magnets
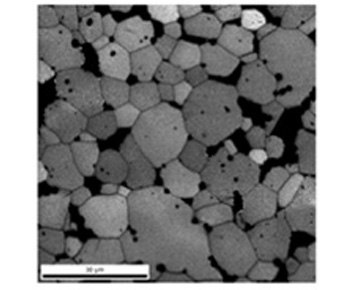
It was found that the main phase (Nd2Fe14B) is composed of crystal grains approximately 10 mm in size, and in many of these grains the C axis (001) is oriented approximately perpendicular to the measurement plane.
However, a detailed investigation of the deviation angle revealed that many grains are slightly inclined in the range of 0°-40°.
-
(a) Secondary electron image -
(b) Image Quality -
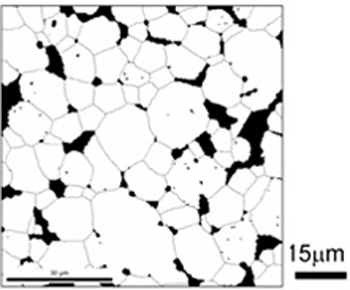
(c) Grain boundary image (Grain map)
-
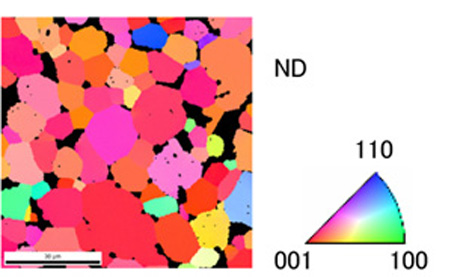
(d) Orientation mapping image (IPF map) -
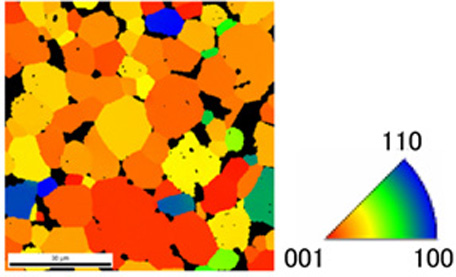
(e) Image of distribution of angles
in crystal grains (crystal direction):
Analysis in the range of 0° to 90° from (001)
-
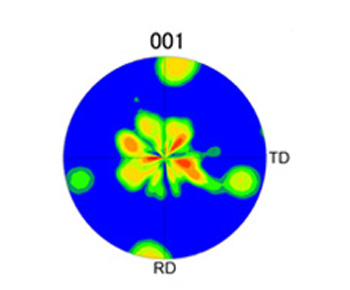
(f) (001) pole figure -
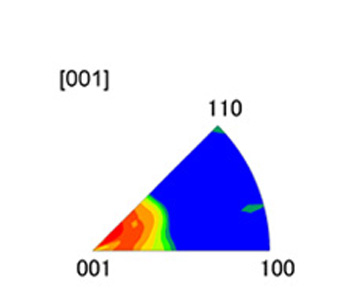
(g) Inverse pole figure (ND) -
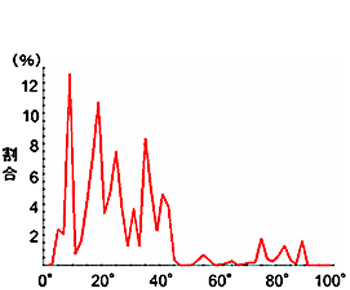
(h) Inclination angle relative to measurement plane
and grain histogram
Quantitative Evaluation of Commercial Neodymium Magnet
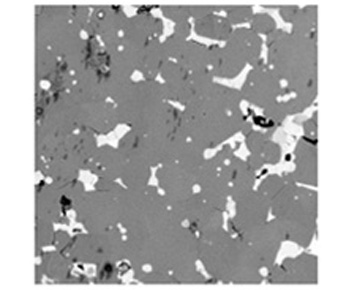
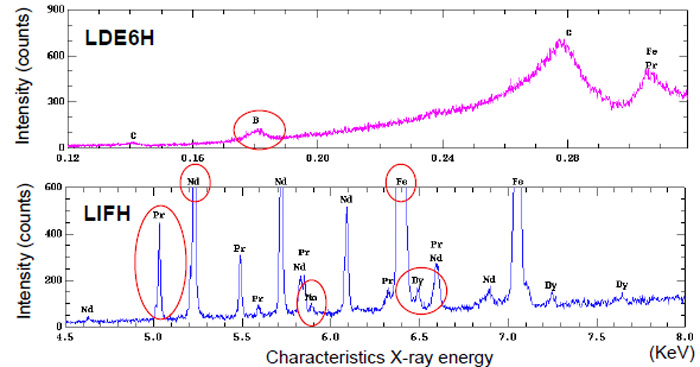
Example of FE-EPMA measurement
As features of EPMA, in comparison with EDX, this technique provides high energy resolution and high detection sensitivity for light elements (B, C). Because the characteristic X-ray energies of Fe, Dy, Nd, and Pr are similar, EPMA is effective in qualitative and quantitative analysis of these elements.
In addition to Nd, Fe, and B, it was found that the main phase contains Dy (dysprosium), and Pr (praseodymium) and Mn in small amounts.
| Measurement position | Element | Nd | Fe | B | Pr | Dy | Mn | O |
|---|---|---|---|---|---|---|---|---|
| Main phase | A | 9.0 | 81.9 | 4.2 | 2.8 | 0.7 | 0.2 | - |
| B | 9.3 | 82.3 | 3.7 | 2.3 | 0.9 | 0.2 | - | |
| C | 9.7 | 82.3 | 4.0 | 2.6 | - | 0.2 | - | |
| Nd(Pr) rich phase | D | 49.7 | 12.4 | - | 29.6 | - | 0.5 | 7.8 |
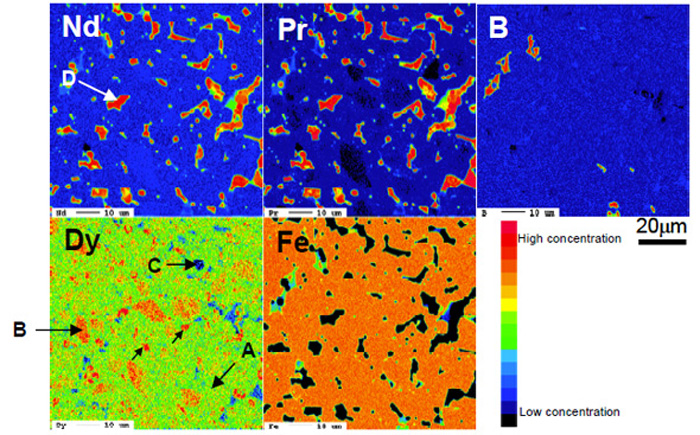
Element Distribution Analysis by FE-EPMA and EBSD
By overlapping the grain boundary image (grain map) on EPMA mapping, it can be understood that Dy also exists in grains and at the grain boundaries.
As illustrated by this example, JFE-TEC proposes composite analysis techniques which take advantage of the respective strengths of EBSD and FE-EPMA.